Marketing your business in a highly digital and networked era is based on creating engaging and informative content for your clients and target market.
In the past we’ve discussed how to create search engine optimized content and how to produce content for social media. Today we’re going to take things beyond the text and discuss the usefulness of infographics.
The truth is that visuals are much more compelling and engaging than text. Sections of text is informative but visuals are much easier to digest, which is great news when it comes to creating website content. According to an article from TIME, people typically spend 15 seconds on a website. Just 15 seconds! That means in order to get people to stay on our websites, then we need to grab their attention and give them the information they are looking for quickly.
This is where infographics save the day.
Infographics have been trending for the last few years, but we’ve noticed that the “trend” is lasting. Infographics aren’t going out of style because they are valuable. These visual narratives are an excellent tool for business marketing that can be continually utilized for producing creative content.
Infographics are Informative
Not only do infographics contain information, but they effectively deliver the message to the viewer very quickly. They provide a means, beyond words, to convey information in an interesting way. Our brains were originally programmed to see visual cues and visual communication gets to the brain 60,000 times faster than text!
One of the advantages of infographics is that they can be used to provide information in various formats. An infographic can be created to tell a story, show steps to a process, or display a map. These are just a few examples of the endless possibilities for infographics.
Reputable designer David McCandless is known for his stunning information design. On his website, Information is Beautiful, you will find examples of how informative infographics truly are.
Take this one, for example. McCandless and his team created a graphic detailing the attributes of various cooking oils, called “Oil Well.”
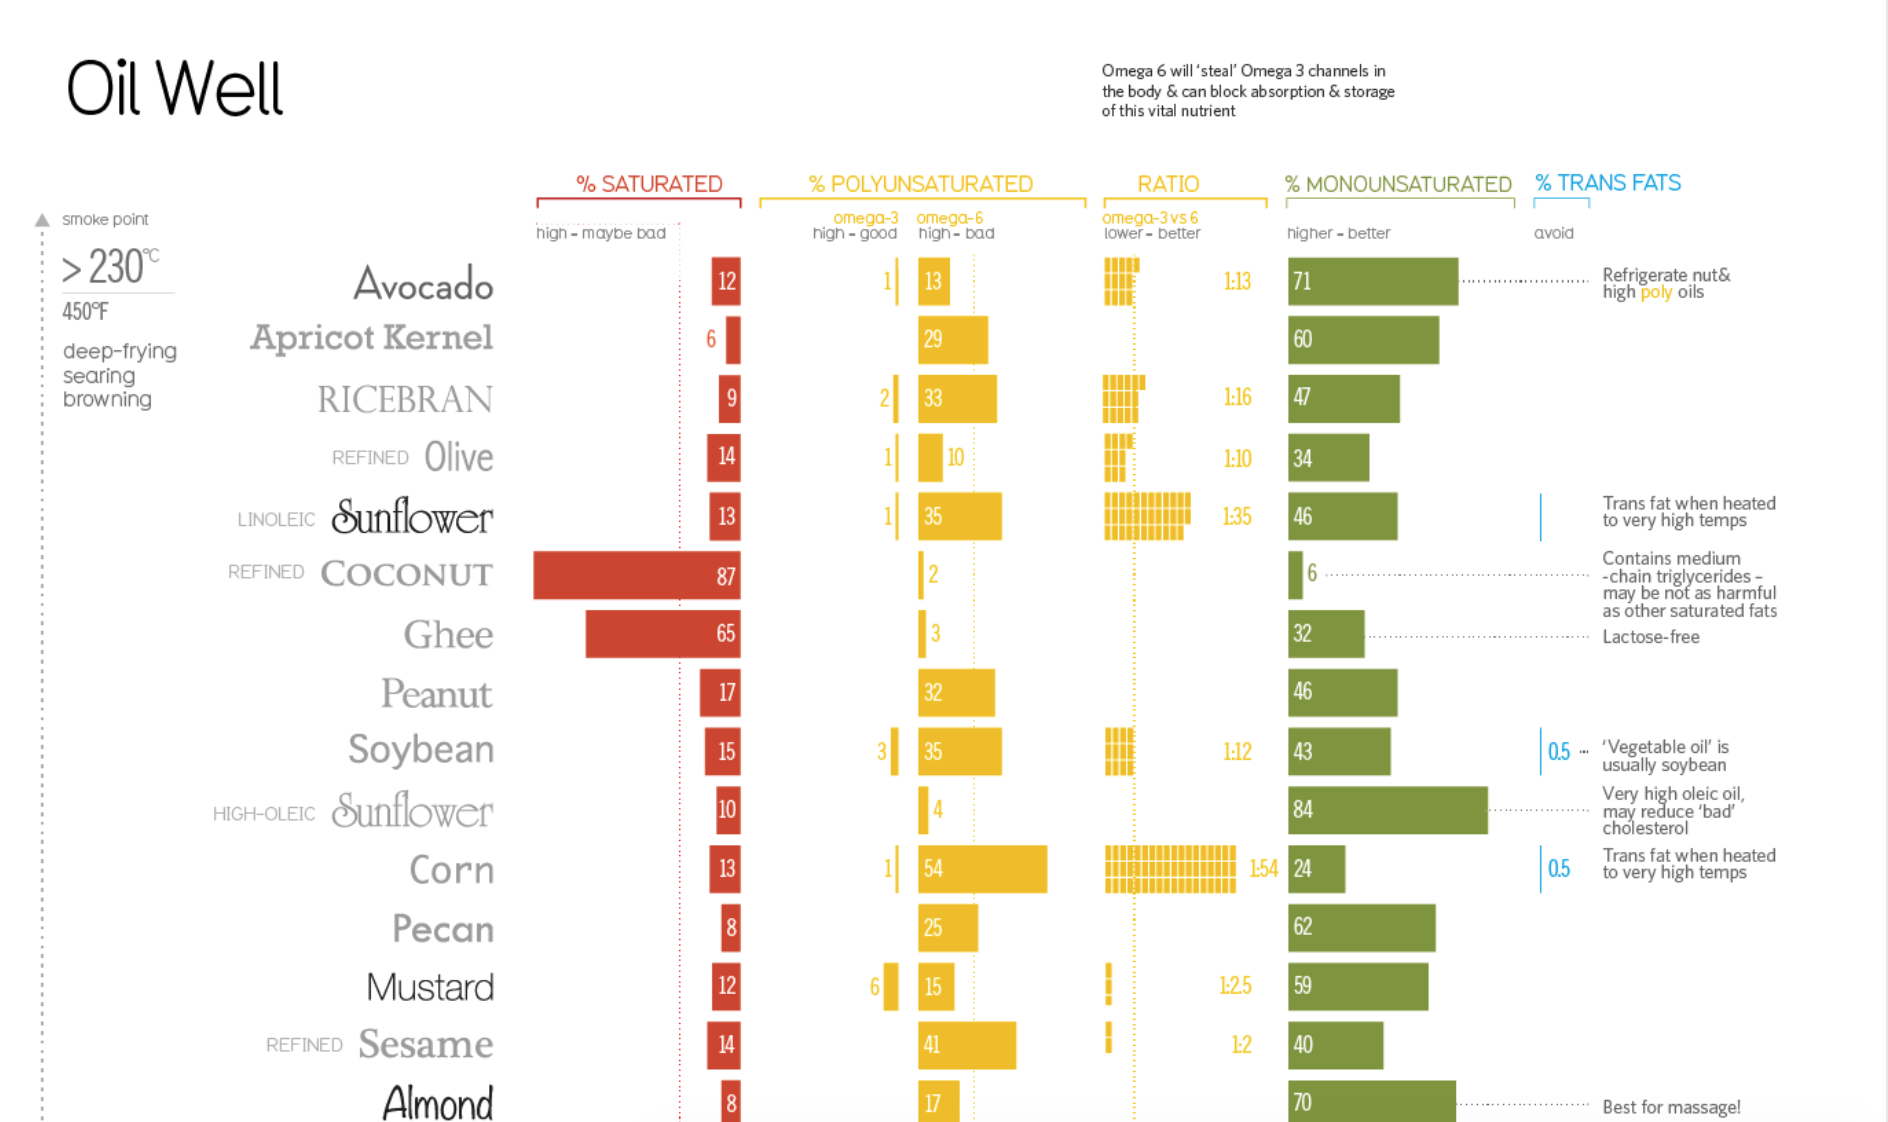
This infographic contains a wealth of information about each cooking oil, and yet it is not overwhelming. There is a simple use of color which refers to the types of fats contained in the oil. They layout is legible and easy to read. Not to mention, this is one of the exceptional times that it’s okay to use multiple typefaces within one design – each typeface used to represent each oil. This is a great example of how infographics can take content and make it useful and beautiful.
Infographics are Engaging
By using infographics to share information, you invite the user to respond. Infographics allow for the use of creative visual aesthetics (such as icons, charts, and graphs), which are much more intriguing than chunks of text. Infographics can also be digitally interactive and direct users to other web pages or sites.
We recently created an infographic for one of our clients, Artificial Turf Express, to inform their audience about the products that they offer. They came to us wanting more graphic elements to increase the visibility of their business, but were unsure of what they exactly wanted or what would be best. Our design team presented the idea of an infographic and they agreed. We laid out the information and produced a visually appealing infographic that breaks down their product options based on user need.
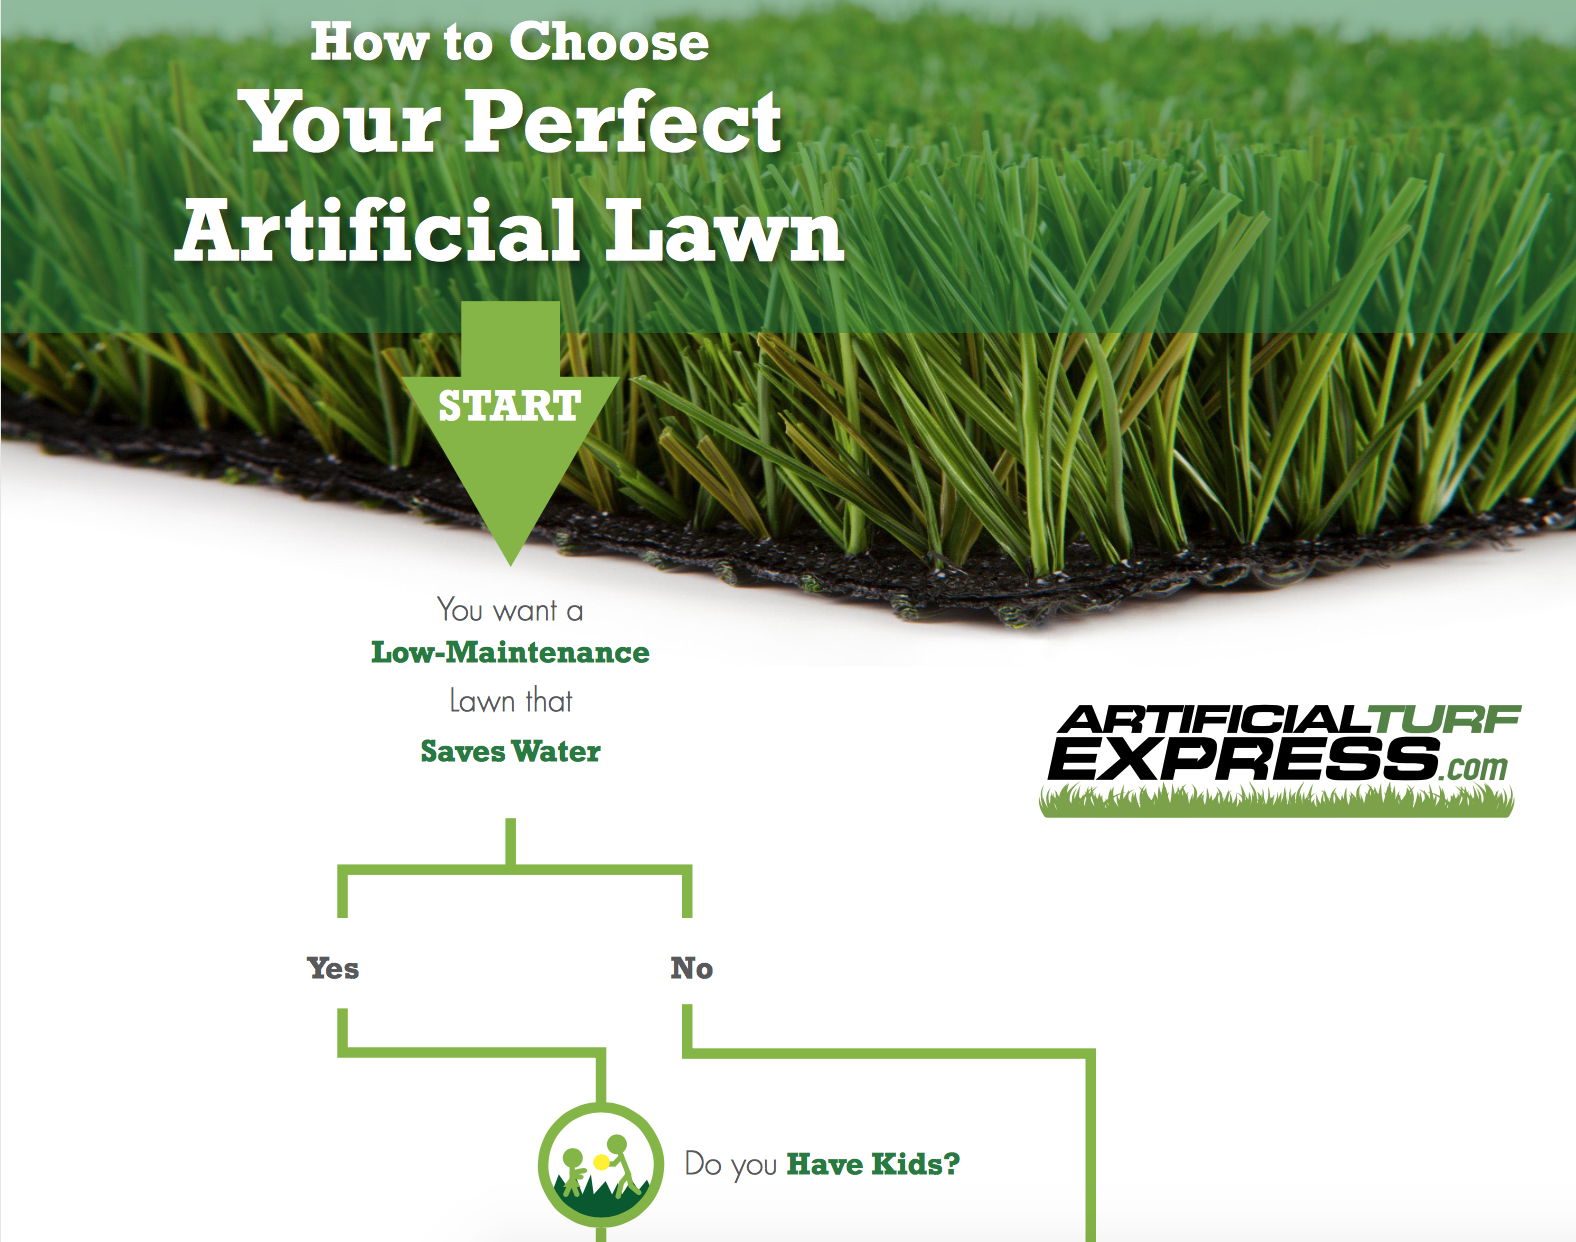
Just by taking a look at this infographic, a potential client can gain understanding of who ATE is as a business, what products they offer, and which type of artificial grass would be best for them. Take a peek at the infographic live on their website! Artificial Turf Express was able to utilize this graphic within a blog post, on their website, and share it on social media platforms.
Infographics are a great way to take a large amount of data and narrow it down to a digestible amount through the use of visuals. How overwhelming is it when you go to a website that has large blocks of texts that you have to scroll through, searching for the good stuff? Get creative by using infographics to tell your business’ story or sell your products. A recent report from Modgility states that “86 percent of buyers expressed interest in accessing visual content on demand.” As pointed out in this article, statistics such as this prove that we need to make our content visual and appealing.
Let us know today if you’re interested in having more engaging content on your website, blog or social media platforms. We will brainstorm ideas for an infographic that can deliver information about your business.